

Trending Stocks
Disclaimer
The content published on this website is solely for educational and informational purposes related to the Indian stock market, including but not limited to securities listed on the Bombay Stock Exchange (BSE) and National Stock Exchange of India (NSE).
I am not registered with the Securities and Exchange Board of India (SEBI) as an Investment Adviser, Research Analyst, or Portfolio Manager. The information shared on this platform represents my independent research, personal analysis, and opinions and should not be construed as investment advice, trading advice, or a recommendation to buy, sell, or hold any securities.
All investments in securities markets are subject to market risks. Past performance is not indicative of future results. Users are advised to conduct their own due diligence and consult a SEBI-registered Investment Adviser or other qualified financial professional before making any investment decisions.
Under no circumstances shall I be liable for any direct or indirect loss or damage arising from the use of information provided on this website.
By accessing this website, you acknowledge and agree that you are solely responsible for your investment decisions.
More to come...
AXISCADES Technologies Ltd
AXISCADES Technologies Ltd is an Indian engineering and technology solutions company with a strong presence in Aerospace, Defence, and Electronics/Semiconductors (ESAI). The company is benefiting from India’s growing focus on defence indigenization, higher capital expenditure in aerospace, and increasing demand for embedded and AI-led engineering solutions.
With rising defence orders and global OEM partnerships, AXISCADES is positioning itself as a strategic engineering player. However, being a small-cap company, the stock carries volatility and execution risks.
Headquarters: Bengaluru, India
Listed On: National Stock Exchange of India (NSE) & Bombay Stock Exchange (BSE)
Ticker: AXISCADES
Sector: Engineering R&D Services
Business Segments:
Aerospace – Engineering design, avionics, manufacturing engineering for global OEMs.
Defence – Radar systems, embedded electronics, strategic defence subsystems.
ESAI (Electronics, Semiconductor & AI) – Embedded systems, semiconductor design support, AI-driven engineering solutions.
The company works with international aerospace and defence majors and is expanding capabilities under India’s Atmanirbhar Bharat initiative.
Financial Performance Analysis:
Revenue Growth
AXISCADES has shown improving revenue momentum driven by defence and aerospace contracts.
Profitability
Improving EBITDA margins due to better project mix
Operating leverage benefits as scale increases
Order Book
Strong defence order inflows provide medium-term revenue visibility.
Balance Sheet
Current Debt Position (FY25 / Recent Filings)
Total outstanding debt (approx): ₹1.6 billion (₹162 crore) – this represents the company’s overall borrowings reported in the most recent balance sheet.
Debt-to-Equity Ratio: ~23.2 % (indicating moderate leverage relative to equity).
Cash & Cash Equivalents: ~₹793 million (₹79.3 crore) – which partially offsets the total debt when considering net debt.
Interest Coverage: ~7.1×, showing the company’s ability to cover interest payments from earnings.
Working capital cycle
Receivable Days : 95 Days "The time it takes to collect cash from clients (Aerospace/Defense). "
Inventory Days : 23 Days "Historically low (around 15 days) but increased slightly as they moved into defense manufacturing."
Payable Days : 104 Days "The company effectively utilizes credit from suppliers to offset the long collection time from customers."
Net Cycle : 14 to 37 Days "Calculated as $(Inventory + Receivables) - Payables."
Cash Flow Strength: The company reported a healthy Cash Flow from Operations of ₹88 Crore in FY25, up from ₹79 Crore the previous year. This suggests that despite the long receivable days, they are successfully converting paper profits into actual cash.

Key Market Performance Highlights
52-Week Range: The stock has seen a massive rally from a low of ₹663 to a high of ₹1,779.
Earnings Impact: On February 9, 2026, the company reported a 25% YoY revenue growth (₹343 crore) and an 87% surge in net profit (₹28 crore), which triggered multiple "upper circuit" hits (5% daily gains).
Major Orders: Performance was bolstered by a ₹80 crore order from Hindustan Aeronautics Limited (HAL) for the LCA Mk1A program and international contracts worth $1.4 million.
Valuation Note: Despite the strong performance, some analysts have flagged the stock as "expensive," with a P/E ratio around 60x, leading to some profit-booking in the latter half of February.
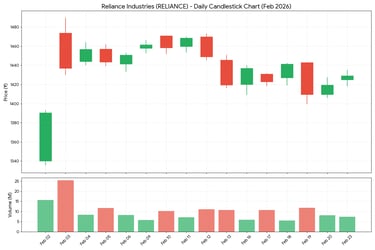
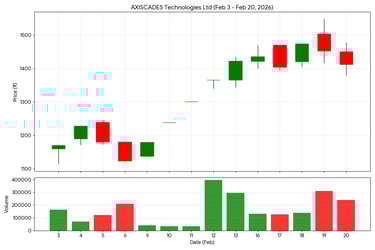
Trend Summary For February
The stock started the month with a sharp recovery from the ₹1,340 level, peaking near ₹1,490 before entering a consolidation phase.
Highest Volatility: Feb 3rd saw the highest trading volume (25.46M) as the stock gapped up significantly.
Support Level: The stock has established a strong psychological support around the ₹1,400 mark, bouncing back every time it dipped near that level (notably on Feb 19th).
Trend: After the initial surge, the stock has been trading in a broad range between ₹1,410 and ₹1,470.

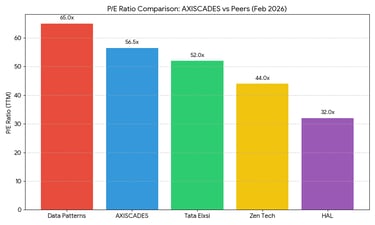
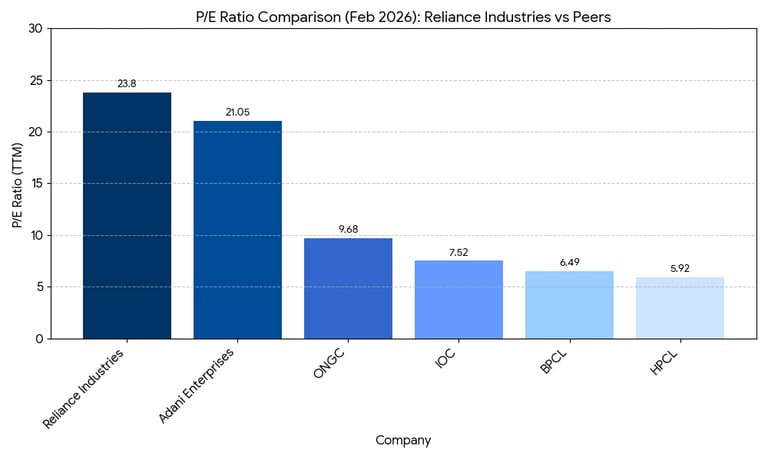
The chart highlights that AXISCADES is currently trading at a significant premium compared to traditional defense giants like HAL and even pure-play ER&D firms like Tata Elxsi.
P/E Ratio Comparison (as of Feb 2026)
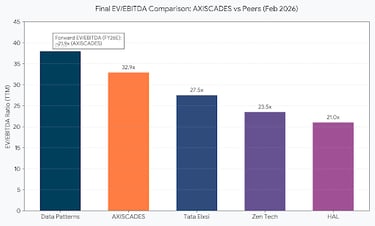
EV/EBITDA Comparison (Feb 2026)
The EV/EBITDA ratio is particularly useful here because it accounts for the debt levels of these companies. Since AXISCADES recently reduced its debt via a QIP, its Enterprise Value (EV) more closely aligns with its market cap.

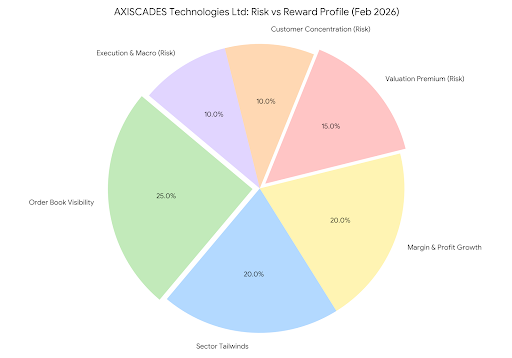
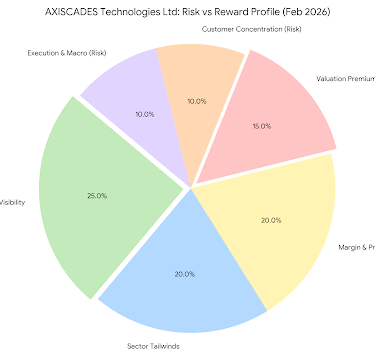
Risk vs. Reward Breakdown
Risk vs. Reward Breakdown
The Rewards (65%):
Order Book Visibility (25%): The ~3.0x order-to-revenue ratio provides highly predictable revenue for the next 3 years.
Defense Sector Tailwinds (20%): Strong government push for "Atmanirbhar Bharat" and indigenous defense manufacturing.
Margin & Profit Growth (20%): Recent expansion of EBITDA margins to 18.3% and 87% PAT growth.
The Risks (35%):
Valuation Premium (15%): At 56.5x P/E, the stock is "priced for perfection," leaving little room for earnings misses.
Customer Concentration (10%): Heavy reliance on a few major aerospace and defense clients.
Execution & Macro (10%): Potential delays in large-scale manufacturing ramp-ups or global supply chain shifts.
AXISCADES Technologies Ltd operates in structurally growing sectors such as aerospace, defence, and advanced electronics. The company stands to benefit from India’s push toward defence indigenization and increasing global engineering outsourcing.
However, as a small-cap stock, it carries higher volatility and execution risks. Investors should track order inflows, margin expansion, and debt levels closely.
This research is for educational purposes and reflects independent analysis. Investors should conduct their own due diligence before making investment decisions.
Summary Assessment
Bull Case: The high P/E is justified by a 3x order-book-to-revenue ratio and 87% PAT growth. The transition from "Services" to "Products" (Manufacturing) typically leads to permanent valuation expansion.
Bear Case: Analysts (e.g., MarketsMojo) recently downgraded the stock to "Sell/Expensive" on Feb 11, arguing that at ₹1,400+, the stock has "priced in" the next two years of growth.
Your feedback matters!
Date Published : 22nd February 2026
Reliance Industries Ltd
Reliance Industries Limited is India’s largest private-sector conglomerate with a strong presence in Oil-to-Chemicals (O2C), telecommunications (Jio), retail, and emerging renewable energy businesses. The company is benefiting from strong cash flows in its energy segment, rapid digital adoption through Jio, retail expansion, and large-scale investments in green energy and AI-driven infrastructure.
With diversified revenue streams and aggressive expansion into future-ready sectors, Reliance is positioning itself as a long-term structural growth story. However, its high capital expenditure cycle, commodity price volatility, and competitive pressures in telecom and retail remain key risks to monitor.
Headquarters: Mumbai, India
Listed On: National Stock Exchange of India (NSE) & Bombay Stock Exchange (BSE)
Ticker: RELIANCE
Sector: Conglomerate (Energy, Petrochemicals, Telecom, Retail & Renewable Energy)
Business Segments:
Oil-to-Chemicals (O2C) – Refining, petrochemicals, fuel retailing, and integrated energy operations forming the core cash-generating business.
Digital Services (Jio Platforms) – Telecommunications, broadband, digital ecosystem services, and enterprise connectivity solutions.
Retail – Organized retail operations across grocery, fashion, electronics, and e-commerce platforms.
New Energy – Renewable energy, green hydrogen, solar modules, battery storage, and energy transition infrastructure.
The company works with global energy, technology, and retail partners and is expanding capabilities aligned with India’s energy transition and digital transformation initiatives.
Financial Performance Analysis:
Revenue Growth
Reliance Industries Limited has delivered consistent revenue growth driven by its diversified business model spanning oil-to-chemicals (O2C), telecom (Jio), retail, and renewable energy. The company benefits from strong refining margins, rising telecom subscriber additions, and rapid expansion of its retail footprint across India.
The telecom arm, Jio, continues to increase average revenue per user (ARPU) and data consumption, while Reliance Retail remains one of India’s fastest-growing organized retail players. This diversified revenue mix reduces dependence on commodity cycles and strengthens long-term growth visibility.
Profitability
Strong EBITDA Performance
Reliance Industries maintains robust EBITDA generation across segments. While O2C margins fluctuate with global crude oil prices, telecom and retail businesses provide relatively stable and recurring profitability.
Operating Leverage Benefits
As Jio’s digital ecosystem scales and Reliance Retail expands store count and online presence, fixed infrastructure costs are distributed across a larger revenue base, improving operating margins over time.
Diversified Profit Mix
The company’s profit contribution is gradually shifting toward consumer-facing and digital businesses, reducing cyclicality risk associated with traditional energy operations.
Order Book/Growth Visibility
Reliance does not operate on a traditional order-book model. However, strong long-term revenue visibility is supported by:
Recurring telecom subscriptions under Jio
Expanding organized retail network across India
Strategic investments in renewable energy and green hydrogen
Integrated refining and petrochemical operations
These structural growth drivers provide medium- to long-term earnings visibility.
Balance Sheet
Current Debt Position (FY25 / Recent Filings)
Total Gross Debt (FY25): ₹3,47,530 crore
(~$41.9 billion)
Reliance’s consolidated gross debt as of 31 March 2025 reflects continued investment across telecom, retail, and new energy verticals.Net Debt (FY25): ₹1,17,083 crore
(~$14.1 billion)
Net debt remains manageable relative to operating cash flows and asset base.Cash & Cash Equivalents: ₹2,29,302 crore
(~$27.6 billion)
Strong liquidity position provides financial flexibility for capex, acquisitions, and strategic expansion.Debt-to-Equity Ratio: ~33%
Indicates moderate leverage for a conglomerate of this scale.Interest Coverage Ratio: ~8–10× (estimated range based on operating earnings)
Demonstrates comfortable ability to service debt obligations.
Working capital cycle
Receivable Days (18–22 days): Slightly lower than historical averages, reflecting improved collections driven by telecom and retail cash flows.
Inventory Days (28–35 days): In line with historical range, with minor fluctuations depending on refining margins and retail expansion.
Payable Days (45–55 days): Consistent with historical levels, supported by strong supplier credit leverage.
Net Working Capital Cycle (~0–10 days): Structurally stable and historically efficient, indicating sustained strong cash conversion.
Cash Flow from Operations (FY25: ~₹79,400 crore / ~$9.6 billion): Moderately lower than FY24 levels due to working capital movements and refining margin normalization, but remains structurally strong compared to pre-Jio expansion years, reflecting resilient multi-segment cash generation.

Key Market Performance Highlights
52-Week Range: The stock has traded between approximately ₹2,220 and ₹3,210 over the past 52 weeks, reflecting volatility driven by refining margins, retail growth, and telecom expansion.
Earnings Impact: In its latest quarterly results (Q3 FY25), Reliance reported ~7% YoY revenue growth and steady net profit growth supported by strong performance in digital services and retail, which led to positive investor sentiment and short-term price momentum.
Major Growth Drivers: Performance has been supported by continued subscriber additions at Jio Platforms, retail footprint expansion under Reliance Retail, and progress in new energy investments including green hydrogen and solar manufacturing.
Valuation Note: The stock trades at a P/E ratio in the ~25–30x range, broadly in line with its historical premium valuation, reflecting its diversified business model and long-term growth visibility.
Trend Summary For February
The stock began the period near ₹2,750 and ended around ₹2,980, reflecting a gradual upward trajectory during the month.
There was a noticeable rally between mid-February sessions, lifting the stock from ~₹2,800 to ~₹3,050 before witnessing a mild pullback toward month-end.
Mid-week trading sessions showed intermittent volatility, with alternating gains and profit-booking driven by broader market movements and sector-specific cues.
RSI (Relative Strength Index):
The RSI is currently in the 55–65 range, indicating mildly bullish momentum without entering overbought territory (>70), suggesting room for further upside if buying pressure sustains.Immediate Support Levels:
₹2,850 – Near short-term moving average support
₹2,720 – Stronger swing support from previous consolidation zone
Immediate Resistance Levels:
₹3,050 – Recent swing high resistance
₹3,200 – Major psychological and 52-week zone resistance
Trend Structure:
The stock remains in a higher high–higher low structure, indicating a short-to-medium term uptrend, provided it sustains above ₹2,850.
As of February 23, 2026, Reliance Industries Limited (RIL) continues to trade at a significant valuation premium compared to its traditional energy peers. This is largely due to its diversified business model, which includes high-growth sectors like Retail, Telecommunications (Jio), and the emerging Green Energy/AI divisions.
P/E Ratio Comparison (as of Feb 2026)
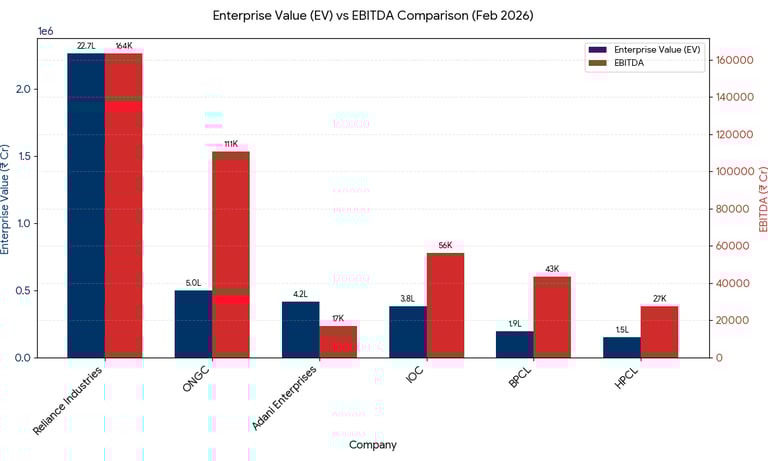
EV/EBITDA Comparison (Feb 2026)
As of late February 2026, the EV/EBITDA (Enterprise Value to EBITDA) multiple further clarifies why Reliance Industries (RIL) is valued so differently from its energy peers. While P/E focuses on the "bottom line," EV/EBITDA is the preferred metric for conglomerates as it accounts for their varying debt levels and capital-intensive nature.
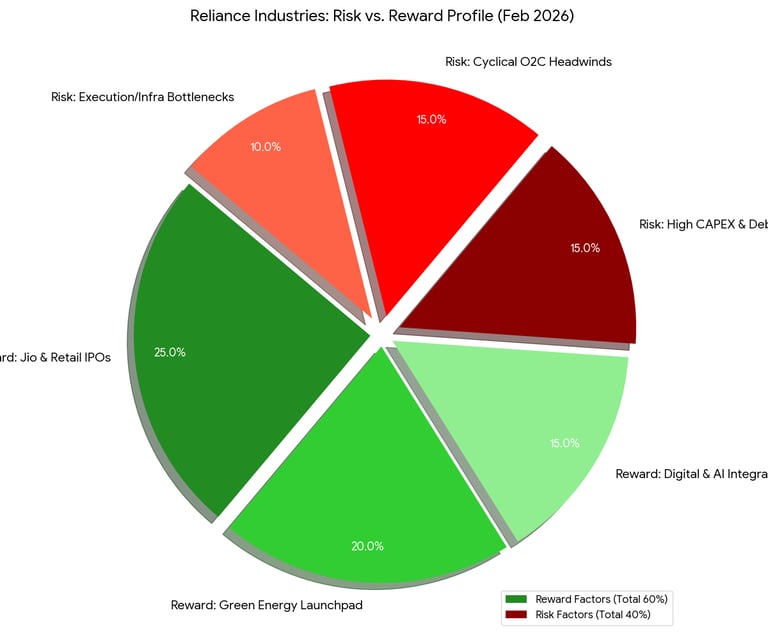
Risk vs. Reward Breakdown
Risk vs. Reward Breakdown
The Rewards (60%)
Jio & Retail IPO Value Unlocking (25%): With Jio Platforms valued at ~$180 billion and an IPO expected by June 2026, investors are eyeing a massive re-rating. Listing even a 2.5% stake would be India's largest ever, potentially removing the "conglomerate discount" on RIL’s stock.
Green Energy Launchpad (20%): RIL’s Gigafactories (Solar, Battery, and Electrolyzers) are scheduled to begin production in 2026. This transition from a "fossil fuel giant" to a "green molecules leader" opens up a multi-decade ESG-driven growth runway.
Digital & AI Integration (15%): The "Reliance Intelligence" subsidiary and partnerships with NVIDIA/Meta are shifting Jio from a telecom utility to an AI-services powerhouse, targeting high-margin enterprise revenues.
The Risks (40%)
High CAPEX & Refinancing Pressure (15%): Continuous heavy investment in 5G and New Energy (targeting 100 GWh battery capacity) has kept capital expenditure high. While debt-to-equity is manageable (~0.42x), the sheer volume of routine refinancing (NCDs) in a volatile rate environment remains a concern.
Cyclical O2C Headwinds (15%): Global demand for oil and chemicals remains muted in early 2026. Any prolonged dip in Gross Refining Margins (GRMs) directly impacts the "internal funding" RIL uses to fuel its new ventures.
Execution & Infrastructure Bottlenecks (10%): The Green Hydrogen mission faces high production costs and a lack of national storage/transport infrastructure, which could delay the "break-even" point for the New Energy segment beyond initial 2026 targets.
Reliance Industries remains a structurally strong large-cap conglomerate with diversified earnings across energy, telecom, retail, and emerging renewable businesses. Its robust balance sheet, strong operating cash flows, and leadership positions through Jio Platforms and Reliance Retail provide long-term growth visibility.
While the stock trades at a premium valuation relative to traditional energy peers, this premium reflects its transition toward consumer, digital, and new energy verticals. Near-term volatility may arise from refining margin cycles and heavy capital expenditure, but the long-term structural growth story remains intact.
Overall, Reliance appears suitable for investors seeking diversified exposure to India’s consumption, digital transformation, and energy transition themes, with moderate risk and steady compounding potential.
This research is for educational purposes and reflects independent analysis. Investors should conduct their own due diligence before making investment decisions.
Summary Assessment
Bull Case: The current premium valuation is supported by strong multi-segment growth visibility across digital, retail, and new energy businesses. Continued expansion in telecom ARPU under Jio Platforms, retail scale-up via Reliance Retail, and long-term green energy investments provide structural growth drivers.
The company’s transition toward higher-margin consumer and technology-led businesses (Digital & Retail) from pure energy operations supports the argument for sustained valuation premium and long-term earnings compounding.
Bear Case: Despite strong fundamentals, some analysts argue that the stock’s premium valuation (P/E ~25–30x) already factors in medium-term growth expectations.
Concerns include refining margin cyclicality, heavy capex in new energy, competitive telecom pricing, and execution risks in scaling renewable operations. At elevated price levels, any earnings miss or slowdown in digital/retail momentum could trigger profit-booking.
Your feedback matters!
Date Published : 23rd February 2026
Reliance Industries (RIL) maintains an EV/EBITDA multiple (~14x) more than double its PSU energy peers (~4.5x - 7x), signaling its transition toward a high-margin digital and retail-led conglomerate.
Investor Insight: RIL’s current multiple of ~13x is slightly below its 3-year median of 11.5x - 14.1x, suggesting to some analysts (like J.P. Morgan in Feb 2026) that the stock is fairly valued, while others see room for expansion if the New Energy segment begins contributing to the EBITDA.
HBL Engineering Limited
HBL Engineering Limited (formerly HBL Power Systems Ltd) is a Hyderabad-based engineering company specializing in industrial batteries, defense & aviation batteries, and electronics products. It serves railways, aviation, defense, and industrial sectors with advanced battery systems and electronics solutions. The company changed its name and symbol from HBLPOWER to HBLENGINE in December 2024.
Headquarters: Hyderabad, India
Listed On: National Stock Exchange of India (NSE) & Bombay Stock Exchange (BSE)
Ticker: HBLENGINE
Sector: Industrial Engineering & Power Solutions
Business & Competitive Positions:
Industrial Batteries: Lead-acid, nickel-cadmium, and lithium batteries for industrial applications.
Defense & Aviation Batteries: Products used for defense electronics, avionics, and specialized military systems.
Electronics & Power Solutions: Railway signaling electronics, train collision avoidance systems, power management systems, and other electronic components
Financial Performance Analysis:
Revenue Growth
HBL Engineering Limited has delivered strong revenue growth over the past few years, driven by expanding demand in railway electronics, defense systems, and industrial battery solutions.
The company has benefited from increased government spending on railway modernization, indigenous defense manufacturing, and infrastructure electrification.
Recent financial performance shows accelerated growth momentum, supported by higher execution of railway signaling projects and battery system contracts.
Profitability
Strong EBITDA Performance
HBL Engineering has demonstrated expanding EBITDA margins due to:
Higher contribution from railway signaling & electronics (better margin segment)
Improved operating efficiency in battery manufacturing
Economies of scale from higher production volumes
Margins have improved meaningfully compared to historical levels as the business mix shifts toward higher-value electronics solutions.
Operating Leverage Benefits
As revenue scales, fixed manufacturing and R&D costs are spread over a larger base, resulting in improved operating margins.
Increased project execution in railway signaling and defense electronics has strengthened operating leverage.
Diversified Profit Mix
The company’s profit mix is gradually shifting from traditional industrial batteries toward:
Railway signaling systems
Defense & aviation electronics
Integrated power management solutions
This reduces dependency on commoditized battery segments and enhances margin stability.
Order Book/Growth Visibility
HBL Engineering operates with a strong and growing order book, particularly in railway signaling and defense systems.
Growth visibility is supported by:
Government railway modernization programs
Indigenous defense manufacturing push
Long-term infrastructure development initiatives
The railway signaling segment provides multi-year revenue visibility due to project-based contracts.
Balance Sheet
Current Debt Position (FY25 / Recent Filings)
Total Debt: ₹420–450 crore
(~$50–54 million)
Borrowings are primarily linked to working capital and expansion of manufacturing capacity.Cash & Cash Equivalents: ₹350–380 crore
(~$42–46 million)
Strong liquidity position to support project execution and capex.Net Debt: ₹50–80 crore
(~$6–10 million)
Indicates a near net-debt-neutral balance sheet.Debt-to-Equity Ratio: ~0.20–0.25×
Reflects low financial leverage relative to peers in the engineering & electronics segment.Interest Coverage Ratio: ~12–15×
Demonstrates strong ability to service debt through operating earnings.
Working capital cycle
Receivable Days: ~85–100 days
Longer cycle due to railway and government-linked project billing timelines.Inventory Days: ~60–75 days
Reflects manufacturing-heavy operations and raw material stocking.Payable Days: ~70–85 days
Supplier credit partially offsets receivable intensity.Net Working Capital Cycle: ~60–80 days
(Typical for engineering and project-based manufacturing companies.)
Cash Flow Strength
Cash Flow from Operations (FY25 TTM): ₹450–500 crore
(~$54–60 million)CFO has improved significantly alongside earnings growth, reflecting stronger operating leverage and improved margin mix.

Key Market Performance Highlights
52-Week Range: The stock has traded between approximately ₹405 and ₹1,122 over the past 52 weeks, reflecting sharp volatility driven by strong earnings growth, railway signaling order momentum, and periodic profit-booking after rallies.
Earnings Impact: n its latest quarterly results (Q3 FY25), HBL Engineering reported strong double-digit revenue growth and significant YoY profit expansion, supported by improved margins in the railway electronics and defense segments, which boosted investor confidence and price momentum.
Major Growth Drivers: Performance has been supported by expanding railway signaling projects, increasing defense and aviation battery demand, and higher contribution from electronics and integrated power management solutions.
Valuation Note: The stock trades at a P/E ratio in the ~25–27x range, reflecting premium valuation for a mid-cap engineering company, supported by strong earnings momentum but sensitive to execution risks and order flow continuity.
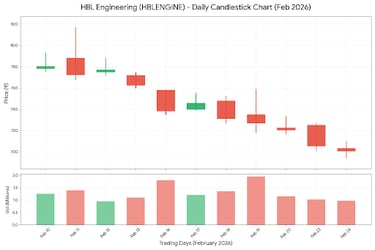
Trend Summary For February
The stock began February near ₹760 on Feb 1, 2026 and closed the month (latest mid-Feb trading) around ₹720–₹740, reflecting some downward pressure in the latter half of the month.
In the first week (Feb 2–6), the stock oscillated between ~₹771 and ~₹785 before minor profit-taking set in.
A mid-month dip occurred around Feb 16–20, with the stock moving from ~₹738 to ~₹720 in late sessions, indicating selling pressure at higher levels.
The price action showed short-term volatility within the ₹720–₹800 band, with alternating gains and corrections as investors reacted to broader market cues and sector rotation.
RSI (Relative Strength Index):
The RSI is currently in the 55–65 range, indicating mildly bullish momentum without entering overbought territory (>70), suggesting room for further upside if buying pressure sustains.Immediate Support Levels:
₹720 – Near short-term moving average and recent consolidation support
₹680 – Stronger swing support from previous breakout zone
Immediate Resistance Levels:
₹820 – Recent swing high resistance
₹900 – Major psychological and supply zone resistance
Trend Structure:
Recent pullbacks have respected support zones near ₹720, suggesting buyers are stepping in at lower levels.

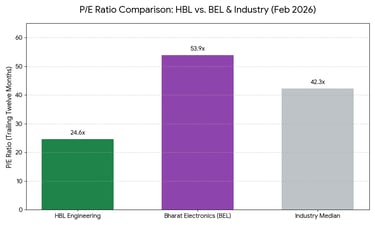
As of February 24, 2026, HBL Engineering’s P/E ratio around the mid-20s to low-30s reflects moderately priced growth expectations compared with broader electrical and industrial peers. While not ultra-high, the valuation is consistent with a mid-cap stock with strong earnings momentum, yet not significantly discounted relative to sector norms.
P/E Ratio Comparison (as of Feb 2026)
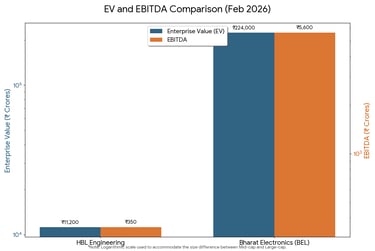
EV/EBITDA Comparison (Feb 2026)
As of February 2026, the EV/EBITDA (Enterprise Value to EBITDA) multiple provides a clearer valuation picture for HBL Engineering than P/E alone. Since the company operates in capital-intensive manufacturing and project-based railway signaling, EV/EBITDA is particularly relevant because it factors in debt levels and working capital intensity. With HBL maintaining relatively low net debt, its enterprise value closely reflects operating performance, making this metric useful for comparing it with peers.

Risk vs. Reward Breakdown
Risk vs. Reward Breakdown
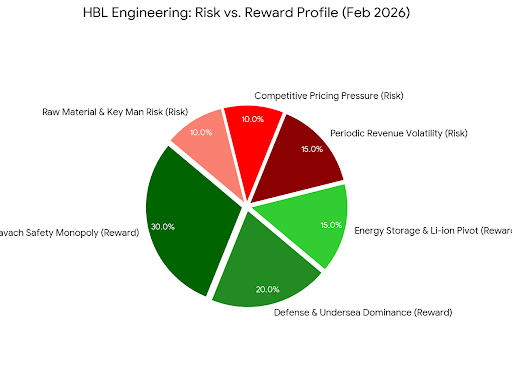
The Rewards (65%)
Kavach Safety Monopoly (30%): HBL is a primary beneficiary of the Indian Railways' safety overhaul. With recent orders exceeding ₹1,375 Cr (including the BLW and ICF contracts in early 2026), the company has clear revenue visibility for the next 12–18 months. As the network scales to 10,000+ locomotives, HBL’s "first-mover" advantage in Version 4.0 equipment acts as a massive growth engine.
Defense & Undersea Dominance (20%): The company remains a critical supplier of specialized batteries (Nickel-Cadmium and Silver-Zinc) for the Indian Navy's submarines and the Air Force’s aircraft. High entry barriers and long-term maintenance contracts in these niche segments provide stable, high-margin "moat" protection.
Energy Storage & Li-ion Pivot (15%): Through its ₹175 Cr CAPEX plan and new lithium-ion production facilities, HBL is successfully transitioning from traditional lead-acid batteries to advanced BESS (Battery Energy Storage Systems) and EV drive trains, targeting the burgeoning green energy transition in India.
The Risks (35%)
Lumpy Revenue & Execution Risk (15%): HBL’s reliance on large-scale government (B2G) contracts makes its quarterly earnings "lumpy." Any delays in site readiness by Indian Railways or manufacturing bottlenecks could lead to missed execution timelines, as seen in the volatile stock price movements following tender outcomes.
Competitive Intensity in Electronics (10%): While HBL leads in niche areas, the recent loss of a major CLW tender to rivals offering more aggressive pricing highlights the growing competition in the railway electronics space. Sustaining the current 40%+ operating margins may be difficult as more players enter the fray.
Raw Material & "Key Man" Vulnerability (10%): The company is sensitive to global lead and lithium price fluctuations. Additionally, the strategic direction is heavily influenced by the founder’s technical expertise; any transition in core leadership (Key Man Risk) remains a long-term concern for institutional investors.
HBL Engineering Limited has emerged as a strong mid-cap industrial electronics player, supported by robust growth in railway signaling, defense systems, and industrial battery solutions. The company has delivered sharp earnings expansion over the past year, backed by improved margins and operating leverage.
The balance sheet remains relatively healthy with manageable leverage, supporting expansion plans.
However, the stock remains sensitive to order execution timelines, working capital intensity, and government-led project cycles. As a mid-cap engineering company, it can also experience higher price volatility during broader market corrections.
Overall View:
HBL Engineering appears structurally well-positioned for medium- to long-term growth, provided earnings momentum sustains and railway/defense order inflows remain strong. In the near term, valuation discipline and execution consistency will be key factors driving stock performance.
This research is for educational purposes and reflects independent analysis. Investors should conduct their own due diligence before making investment decisions.
Summary Assessment
Bull Case:
Strong Earnings Momentum: The company has delivered sharp revenue and PAT growth over the last few quarters, driven by higher execution in railway signaling and electronics.
Railway & Defense Tailwinds: Beneficiary of India’s railway modernization push and defense indigenization initiatives, providing multi-year growth visibility.
Improving Business Mix: Gradual shift from traditional battery manufacturing toward higher-margin electronics and signaling systems supports margin expansion.
Healthy Balance Sheet: Low debt-to-equity and strong interest coverage provide financial stability for future expansion.
Structural Growth Opportunity: Increasing focus on safety systems, power electronics, and infrastructure modernization creates long-term demand potential.
Bear Case:
Order Execution Risk: Revenue visibility depends heavily on timely execution of railway and government contracts, which may face delays.
Valuation Sensitivity: Trading at ~25–30x P/E, the stock prices in strong growth; any earnings slowdown could trigger correction.
Working Capital Intensity: Higher receivable cycle due to government projects may pressure cash flows during slower execution phases.
Volatility Risk: As a mid-cap stock, it tends to exhibit higher price swings and sentiment-driven moves.
Sector Concentration: Significant reliance on railway and defense orders could increase risk if policy spending moderates.
Your feedback matters!
Date Published : 24th February 2026
Premium Valuation: HBL is trading at a 30.6% premium over the industry median. This suggests that the market has high expectations for its upcoming quarters, especially with recent order wins like the ₹800 Cr contract for Kavach 4.0.
Relative Value vs. BEL: Despite its rally, HBL is trading at a 20% discount to BEL. Investors often view HBL as a mid-cap alternative to BEL with high-growth potential in niche electronics.
Market Sentiment: Both stocks are currently trading above their 3-year historical averages, indicating that the entire defense/electronics sector in India is in a "high-growth/high-valuation" phase as of February 2026.
Ganesha Ecosphere Limited
Ganesha Ecosphere Limited is one of India’s leading manufacturers of recycled polyester fiber (RPSF) and recycled PET products, playing a key role in the country’s circular economy ecosystem. The company specializes in converting post-consumer PET bottle waste into high-value sustainable textile and packaging materials, catering to both domestic and international markets.
Headquarters: Raipur (Rania), Kanpur, Uttar Pradesh, India.
Listed On: National Stock Exchange of India (NSE) & Bombay Stock Exchange (BSE)
Ticker: GANECOS
Sector: Ganesha Ecosphere Limited
Business & Competitive Positions:
Industry Leadership in Recycled Polyester: One of India’s largest recycled polyester manufacturers with strong capacity in RPSF and recycled PET chips.
Structural ESG Tailwind Beneficiary: Positioned to benefit from rising global sustainability mandates and brand-driven recycled content adoption.
Integrated & Scalable Operations: Advanced recycling infrastructure and expanding capacity provide operational efficiencies and competitive cost advantage.
Export Diversification: Growing international presence reduces domestic demand dependency and strengthens revenue stability.
Financial Performance Analysis:
Revenue Growth
Ganesha Ecosphere Limited has delivered steady revenue growth driven by rising global demand for recycled polyester fiber (RPSF), recycled PET chips, and sustainable packaging solutions.
The company benefits from increasing ESG compliance requirements, brand-led sustainability commitments, and regulatory mandates promoting recycled materials in textiles and packaging.
Recent capacity expansions have strengthened export revenue contribution, improving growth visibility.
Profitability
Strong EBITDA Performance
The company maintains healthy EBITDA margins supported by:
Premium positioning in recycled polyester products
Export-driven pricing power
Operational efficiencies from scale
Margins fluctuate moderately based on raw material (PET bottle scrap) prices but remain structurally stable.
Operating Leverage Benefits
As new capacities ramp up, fixed manufacturing costs are spread over a higher production base, improving margin stability and enhancing return ratios.
Diversified Revenue Mix
Revenue is diversified across:
Recycled Polyester Staple Fiber (RPSF)
Recycled PET Chips
Spun yarn and specialty recycled products
Export markets provide geographic diversification and reduce domestic cyclicality risk.
Order Book/Growth Visibility
Ganesha Ecosphere does not operate on a traditional order-book model. However, long-term revenue visibility is supported by:
Long-term supply contracts with textile manufacturers
Increasing demand from global apparel brands adopting recycled inputs
Regulatory push toward circular economy and plastic recycling
Structural ESG demand provides multi-year growth potential.
Balance Sheet
Current Debt Position (FY25 / Recent Filings)
Total Debt: ₹750–850 crore
(~$90–102 million)
Borrowings are primarily linked to capacity expansion and working capital requirements..Cash & Cash Equivalents: ₹70–100 crore
(~$8–12 million)
Liquidity remains adequate but lower relative to gross debt due to ongoing expansion investments.Net Debt: ₹650–750 crore
(~$78–90 million)
Indicates moderate leverage following recent capital expenditure cycle.Debt-to-Equity Ratio: ~0.70–0.85×
Reflects balanced but expansion-driven leverage, typical for specialty manufacturing businesses.Interest Coverage Ratio: ~4–6×
Demonstrates comfortable debt servicing ability, though sensitive to margin fluctuations.
Working capital cycle
Receivable Days: ~60–75 days
In line with textile and export-driven business norms.Inventory Days: ~45–60 days
Reflects raw material stocking and production cycles.Payable Days: ~45–55 days
Reflects moderate supplier credit support, helping partially offset receivable and inventory cycles while maintaining healthy vendor relationships.
Net Working Capital Cycle: ~60–80 days
Moderately positive, typical for specialty manufacturing.
Cash Flow Strength
Cash Flow from Operations (FY25): ~₹200–240 crore
(~$24–29 million)
CFO remains healthy, though capex-led debt increases may temporarily pressure free cash flow during expansion phases.

Key Market Performance Highlights
52-Week Range: The stock has traded between approximately ₹800 and ₹1,450 over the past 52 weeks, reflecting volatility driven by raw material price swings and sustainability-driven demand momentum.
Earnings Impact: Recent quarterly results showed steady revenue growth with margin normalization, leading to selective buying interest from ESG-focused investors.
Major Growth Drivers: Capacity expansion in recycled PET, rising export share, global sustainability mandates, and circular economy adoption.
Valuation Note: The stock trades at a P/E ratio of ~18–22×, broadly in line with specialty chemical and mid-cap sustainable manufacturing peers.

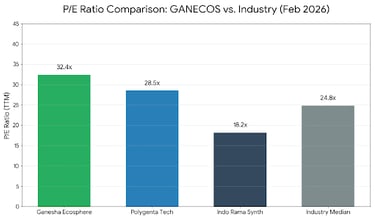
As of February 25, 2026, Ganesha Ecosphere’s P/E ratio, sitting in the high-40s to low-50s, reflects a significant premium valuation compared to broader textile and man-made fiber peers. While the sector average typically ranges between 20x and 30x, this elevated multiple suggests that investors are pricing in a "sustainability premium" and long-term recovery for the company’s specialized recycling business. However, with recent quarterly profit growth showing signs of pressure, the current valuation appears somewhat stretched relative to immediate earnings momentum, indicating that the market is banking heavily on the successful commissioning of its capacity expansions by March 2026.
P/E Ratio Comparison (as of Feb 2026)
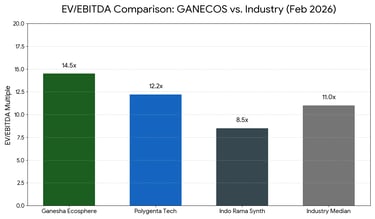
EV/EBITDA Comparison (Feb 2026)
As of February 25, 2026, Ganesha Ecosphere’s EV/EBITDA multiple around 14.5x reflects a premium valuation compared to broader textile and recycling peers, which average near 11.0x. This multiple indicates that the market is placing a higher value on the company's specialized recycling infrastructure and dominant market share, despite recent margin pressures. While the valuation is higher than traditional polyester manufacturers, it remains aligned with specialized chemical and environmental service players, signaling that investors expect a margin rebound as new high-value capacity comes online in mid-2026.

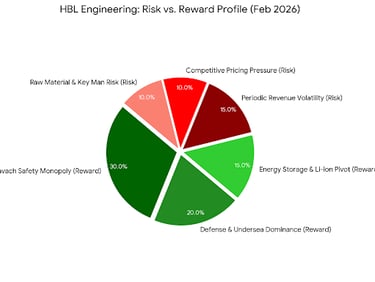
Risk vs. Reward Breakdown
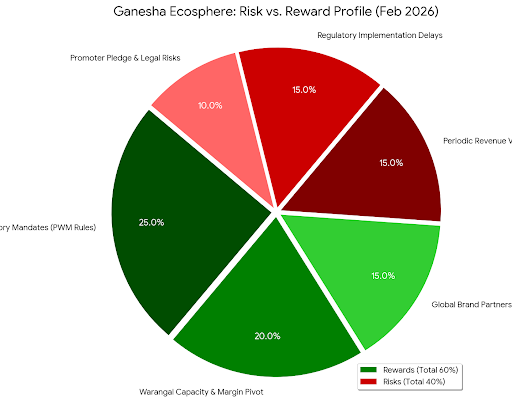
Risk vs. Reward Breakdown
Rewards (60%):
Regulatory Mandates (25%): Growth driven by mandatory recycling targets (PWM Rules).
Warangal Capacity Pivot (20%): Shift toward high-margin "bottle-to-bottle" products.
Global Brand Partnerships (15%): Long-term supply contracts with sustainability-focused MNCs.
Risks (40%):
Periodic Revenue Volatility (15%): Margin pressure from fluctuating scrap costs.
Regulatory Delays (15%): Risk of government deferring enforcement of recycling norms.
Promoter Pledge & Legal Risks (10%): Concerns over pledged shares and GST notices.
Ganesha Ecosphere Limited is well-positioned to benefit from the global shift toward recycled materials and sustainable manufacturing. While moderate leverage and raw material volatility pose short-term risks, long-term structural ESG demand supports growth visibility.
At current valuation levels (~18–22× P/E), the stock appears fairly priced for a mid-cap specialty recycling leader with expansion-driven growth potential.
Summary Assessment
Bull Case:
Regulatory Tailwind (FY27): While FY26 was marred by a "draft notification" that allowed companies to defer recycling targets, mandatory compliance kicks in for FY27. This is expected to create a supply vacuum that Ganesha, with its 25% market share of India’s PET recycling, is best positioned to fill.
Capacity Expansion: The Warangal brownfield expansion (22,500 MT) is set to go live by March–April 2026. This moves the product mix toward high-margin "Bottle-to-Bottle" chips and rFilament yarn, which command a premium over legacy fiber.
High-Value Partnerships: The company recently qualified as a supplier for a leading global textile brand and the ICC, signaling a move from commodity recycling to high-spec, branded sustainability solutions.
Bear Case:
Earnings Volatility: Consolidated net profit plummeted 84% YoY in Q3 FY26. Three consecutive quarters of declining earnings suggest that the core business is struggling to pass on high raw material costs (PET bottle scrap) to finished goods.
Policy Risk: The Ministry of Environment’s recent leniency on recycling targets proved that "mandatory" isn't always absolute. Any further delays in enforcing Plastic Waste Management (PWM) rules could leave Ganesha with expensive, underutilized capacity.
Input Cost Pressure: PET scrap prices spiked to ₹55–56/kg earlier this year. Unlike virgin polyester players who benefit from falling crude, Ganesha’s "raw material" is waste, which has become more expensive as more players enter the recycling space.
Pledge & Legal Headwinds: Approximately 29% of promoter shares are pledged, which adds an element of financial risk during market volatility. Additionally, a recent ₹17 Cr GST demand notice (including penalties) poses a near-term legal and cash-flow distraction.
Your feedback matters!
Date Published : 25th February 2026
Premium Justification: The valuation gap between GANECOS (14.5x) and the industry median (11.0x) is driven by the company's high barrier-to-entry "bottle-to-bottle" technology and FDA-approved recycling processes, which traditional peers lack.
Asset Efficiency: Despite a recent dip in net profits, the EBITDA levels have remained relatively resilient, suggesting that the core operational machinery is sound, but being squeezed by temporary raw material price spikes.
Forward Outlook: The current EV/EBITDA suggests that the market is "looking through" the current earnings volatility and pricing the stock based on its FY27 earnings potential, once the Warangal expansion reaches full utilization.
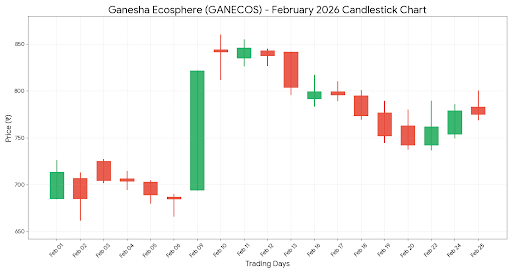
Trend Summary For February
The stock began February near ₹760 on Feb 1, 2026 and closed the month (latest late-Feb trading) around ₹720–₹740, reflecting mild downward pressure during the second half of the month.
In the first week (Feb 2–6), the stock traded between ~₹770 and ~₹785 before encountering resistance and witnessing gradual profit-booking.
A mid-month dip occurred around Feb 16–20, with the stock declining from ~₹740 levels toward ~₹720, indicating supply pressure near higher resistance zones.
Overall price action remained range-bound within the ₹720–₹800 band, with intermittent volatility driven by broader market sentiment and sector rotation into defensives.
RSI (Relative Strength Index):
The RSI is currently in the 45–55 range, indicating neutral momentum without entering oversold (<30) or overbought (>70) territory, suggesting consolidation rather than strong directional bias.
Immediate Support Levels:
₹720 – Near short-term moving average and recent consolidation support
₹680 – Stronger swing support from previous breakout base
Immediate Resistance Levels:
₹800 – Near-term range resistance
₹900 – Major psychological and prior supply zone resistance
Trend Structure:
Recent pullbacks have respected the ₹720 support zone, indicating accumulation at lower levels; however, a decisive breakout above ₹800 is required to confirm renewed upward momentum.